@ 2025 Punit Joshi. All rights reserved
Description
Instructor
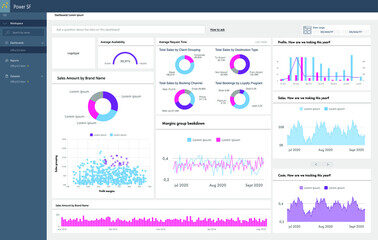
Learn to create dynamic dashboards and analytical reports in Power BI using DAX, data modeling, and visual storytelling — from beginner to advanced level.

🧾 Course Description:
Learn Power BI from scratch and build business dashboards and analytical reports using DAX, visuals, and real data projects.
👤 Who is this for:
Excel users, business analysts, and aspiring BI professionals.
🎯 Target Audience:
Working professionals, reporting teams, managers, and career switchers.
🔑 Pre-requisites:
Basic Excel or data handling knowledge preferred.
🎓 Learning Outcomes:
- Import and model data in Power BI
- Create interactive dashboards and visual reports
- Use DAX to build custom metrics and KPIs
- Apply filters, slicers, and time intelligence
- Work with case studies to build real BI dashboards
🧰 Tools Covered:
Power BI Desktop, Power BI Service, DAX
📦 Includes:
Power BI Beginner, Power BI Advanced, Business Dashboards, Case Studies
⏳ Duration:
5–7 weeks (self-paced)
🎯 Outcome:
Build professional Power BI dashboards and deliver insights through data storytelling.
Course Features
- Duration 32 Hours
- Activities Data and Visualization
1 Student20 Courses
Review
Skills Meet Opportunity
"Success doesn’t come from what you know, but from what you’re willing to learn next"

Courses you might be interested in
Build a strong foundation in Python programming and perform data...
-
Online | Offline | Hybrid
Master Excel from beginner to advanced and apply data analysis...
-
Online | Offline | Hybrid
Perform data analysis using Python libraries. 🧾 Course Description: Use...
-
Online | Offline | Hybrid
Advanced data modeling and analytics in Power BI. 🧾 Course...
-
Online | Offline | Hybrid
Instructor


