


@ 2025 Punit Joshi. All rights reserved
Description
Instructor
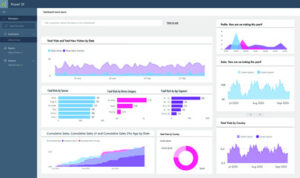
Beginner’s guide to Power BI for data visualization.
🧾 Course Description:
Covers data loading, cleaning, modeling, and basic visualizations in Power BI. Includes dashboards and simple DAX.
👤 Who is this for:
Beginners in BI tools, Excel users moving to Power BI.
🎯 Target Audience:
Students and early-career professionals entering analytics.
🔑 Pre-requisites:
Basic Excel; curiosity for data visualization.
🎯 Learning Outcomes:
- Load and clean data in Power BI.
- Create visual reports and dashboards.
- Understand DAX basics.
- Publish reports online.
Course Features
- Duration 16 Hours
- Activities Power BI

1 Student20 Courses


")
